
Chart settings control the data and behaviour of an individual chart. They are found in the Chart itself once created and in the AncestorPress → All Charts → Create New Chart panel when adding a new Chart.
These settings are per-chart - each chart you create has its own independent settings. Changes here do not affect other charts. Visual styling (colours, fonts, line styles) are available in the Pro Plus plugin.
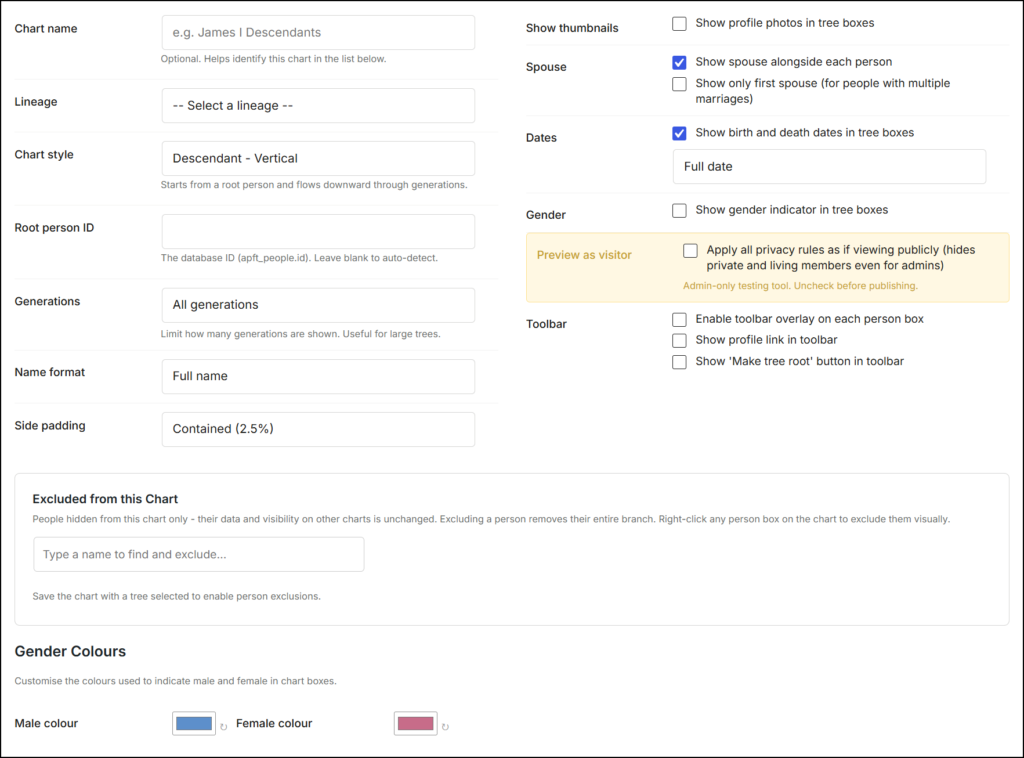
Chart Style #
Selects which of the six chart formats to use. See Chart Types for a description of each option and guidance on when to use them.
Root Person ID #
The person the chart starts from. ID's can be found in the members list on the All Members page.
For descendant charts this should be the oldest ancestor you want to start from. For ancestor/pedigree charts this should be the youngest person whose ancestry you are tracing.
Lineaege #
Selects which Family lineage's member data to draw from. If you have multiple lineages, each chart can display a different one.
Generations #
Controls how many generations to display. Higher numbers show more of the tree but increase page load time for large families and may not be easy to navigate of view on a webpage - this is not a desktop PC! Start with 4 or 5 generations and adjust based on your data.
Toolbar #
Chart boxes can include controls which may vary by that but can, for example, allow users to reset the Root person on the fly to navigate to persons and branches of most interest to themselves, or jump to a person profile page.
Display settings per chart #
Some display options can be set at the chart level to override the global display settings. These may include:
- Whether to show birth and death dates on nodes
- Whether to show spouse information
- Whether to show image thumbnails
- Whether to show gender indicator colours
Excluded from this Chart #
Specify individuals to exclude from a chart - for example you may want to prune less important siblings in a royal line of descent to focus on the main line in the display.
Create and Save #
Click Create Chart to save changes to a new chart and Save Chart to update an existing chart. The updated chart appears immediately on any page where it is embedded - you do not need to update the shortcode or page.